The economy looks strong. But look closer at what’s actually holding it up.
You’ve heard the headlines. Consumer spending is strong. GDP is holding. Retail numbers are up. The American consumer keeps spending.
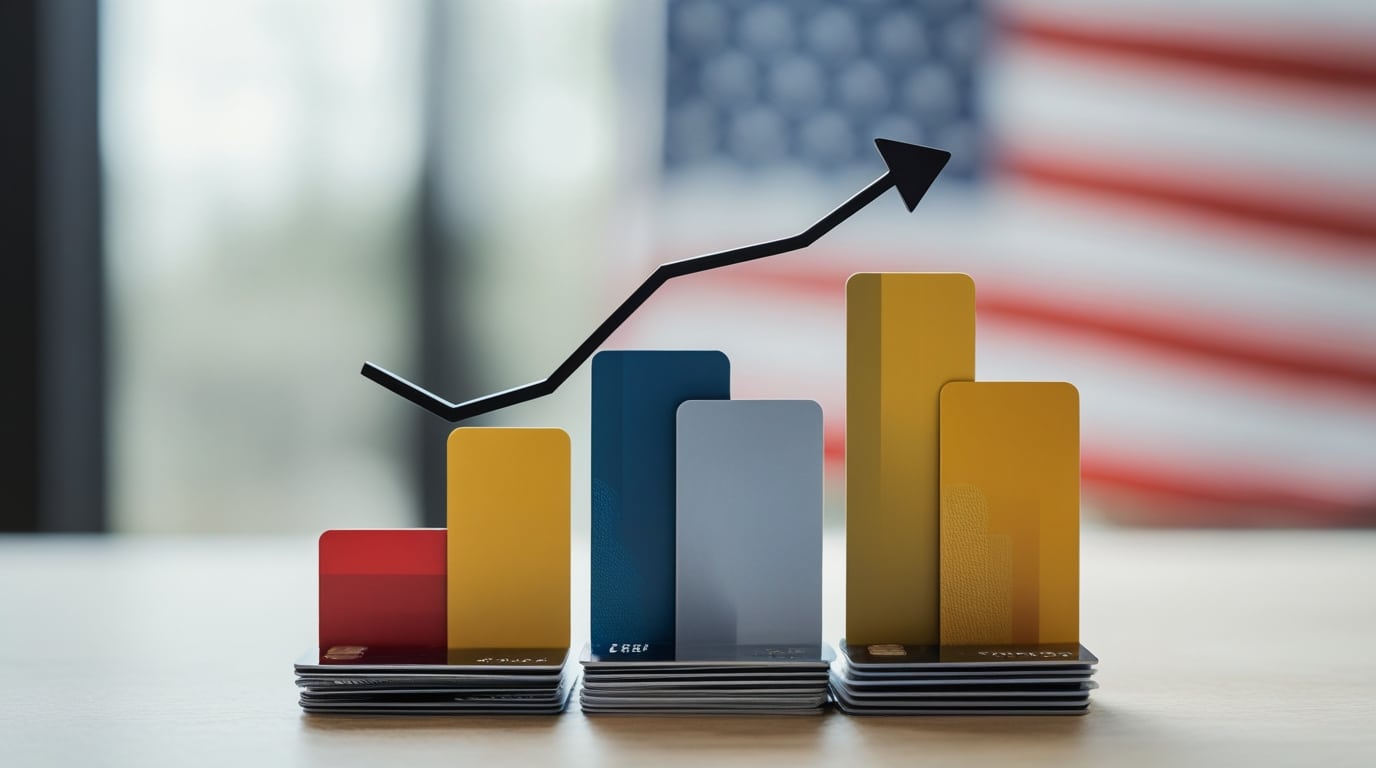
And it’s true. Americans are spending. The number is real.
What the headline doesn’t tell you is where the money is coming from.
It’s not coming from income. It’s coming from debt. And there is a meaningful difference between an economy driven by earned dollars and one driven by borrowed ones — even if the top-line spending numbers look identical.
This article isn’t doom and gloom. It’s a thinking exercise — the kind of exercise the financial media doesn’t run because it makes the story more complicated and the advertisers more uncomfortable. We’re going to look at what’s actually underneath the consumer spending number, what it means for the economy, and what it means for you.
First, Let’s Look at the Actual Numbers
Before we interpret anything, let’s establish what the data actually shows. These are not projections or opinions — these are documented figures from the Federal Reserve, government data, and industry research.
Start with the headline number that almost never gets reported as a single figure: U.S. household debt has reached approximately $18.8 trillion — an all-time high. That is more than the GDP of every country on earth except the United States and China. It is the accumulated weight of what American households owe, and it is still climbing.
Inside that number: $13.2 trillion in mortgage debt. $1.67 trillion in auto loan debt. $1.28 trillion in credit card debt. $1.83 trillion in student loan debt. The average American household carries roughly $105,000 in total debt.
On credit cards alone — the most visible consumer credit category — approximately 47% of cardholders carry a balance from one month to the next, meaning they are paying interest rather than paying in full. Of those carrying balances, 61% have been carrying them for at least a year. And perhaps most telling: 22% of cardholders with balances say they don’t think they’ll ever pay them off.
Read those numbers again. Nearly one in four people with credit card debt has already concluded, internally, that the debt is permanent.
Buy Now, Pay Later has expanded so aggressively that 60% of U.S. consumers have used it — with many now financing groceries and takeout orders through platforms like Klarna, which allows customers to split purchases — including DoorDash food delivery orders — into installment payments.
People are financing furniture. People are using Buy Now, Pay Later for groceries and takeout. The idea that you need to borrow money to eat dinner is not a quirky financial innovation. It is a warning sign.
Here is what makes these numbers personal: the average consumer is likely spending somewhere between 15 and 35% of their household budget on interest payments alone. If your household earns $100,000 a year, that means roughly $25,000 — a quarter of your income — is going straight to lenders before you invest a single dollar, fund a single opportunity, or build a single asset. And yet the standard financial advice is to save 10% and earn a 10% return. You are bailing water out of a boat with a gaping hole in the bottom and wondering why the water level keeps rising.
📖 Related: Bailing Water Out of a Boat with a Hole in the Bottom — Before you optimize your investment returns, understand how much of your income is already leaving through interest. The math will change how you think about every financial decision you make.
What Credit Actually Does to Economic Numbers
Here is the mechanism most people never think about: credit doesn’t just help people buy things. It inflates the price of the things they buy, the volume of things sold, and the GDP number reported at the end of the quarter.
This is not a conspiracy — it is simple mechanics. Understanding it changes how you read every economic headline going forward.
1. Credit Pulls Demand Forward
When someone finances a couch instead of saving up for one, they are consuming today what they would have consumed in the future. This raises current spending numbers. It makes this quarter look better than it would otherwise. But it borrows from future quarters — because that person now has a payment, which reduces what they can spend later.
The Federal Reserve attributes roughly one-third of current personal consumption expenditures directly to credit card spending alone. That is borrowed demand dressed up as economic strength.
2. Credit Inflates Prices
When buyers focus on the monthly payment instead of the total price, sellers gain the ability to raise sticker prices as long as financing keeps payments “affordable.” You’ve seen this in the auto market for decades. You’ve seen it in furniture. You’ve seen it in housing.
BNPL has done the same thing in retail — merchants report average order values increasing 30 to 50 percent when customers use installment plans versus cash. The product didn’t get more valuable. The buyer just stopped comparing the price to their actual cash position.
When credit compresses price sensitivity, prices drift up. When credit eventually tightens, prices have to come down — and that adjustment is never painless.
3. Credit Makes GDP Look Bigger Than It Is
Consumer spending is roughly two-thirds of U.S. GDP. That means when credit-boosted consumption inflates the spending number, it inflates the headline GDP number. An economy where people are borrowing to spend looks, on paper, nearly identical to one where people are earning to spend.
The difference only becomes visible on the balance sheet — in rising household debt levels, climbing delinquency rates, and the growing share of income consumed by debt service. The average household now spends approximately 11% of disposable income on debt payments alone. None of that shows up in the GDP headline.
GDP measures spending. It does not measure whether that spending was funded by wealth or by debt. That distinction is everything.
The Auto Market Is the Best Case Study
The American car market is really the American car-plus-financing market. The two cannot be separated — and that’s not an accident.
Approximately 80–85% of new cars sold in the U.S. are financed — either through a loan or a lease. For used vehicles, financing rates are lower, around 35–40% at the point of purchase. Looking at the entire vehicle fleet on the road, an estimated 35–45% of all vehicles are still under an outstanding auto loan at any given time — a figure that reflects a large number of fully paid-off older vehicles alongside a steady stream of newly financed ones.
Americans now carry $1.67 trillion in outstanding auto loan balances. Delinquency rates have climbed above pre-pandemic levels, approaching territory last seen before 2008. And the vehicles being financed are more expensive than ever — in large part because monthly-payment focus allows sticker prices to rise as long as rates and terms can keep the payment “manageable.”
Ask yourself what the auto market looks like if that financing suddenly tightened. The volume collapses. The prices come down. The dealers that were only viable at credit-inflated volumes close. The lenders that packaged those loans face losses. The commercial real estate tied to those dealerships loses value.
This is not speculation. This is what every credit contraction in history has looked like in credit-dependent industries.
Buy Now, Pay Later: When Financing Becomes Invisible
Buy Now, Pay Later has quietly become one of the most significant changes in consumer behavior of the last decade — and most people don’t register it as borrowing at all.
60% of U.S. consumers have used BNPL. Nearly half of those currently carry at least one active BNPL balance. Many carry several simultaneously.
The categories being financed tell the story: furniture and home decor account for 26 to 42 percent of BNPL purchases. Apparel and electronics round out the top three. And increasingly, BNPL is being used for groceries, takeout, and food delivery — Klarna, one of the largest BNPL platforms globally, allows customers to split DoorDash orders into installment payments.
When you split a $15 food delivery order into three payments, you are not managing your budget. You are borrowing to eat. That is not a stable financial behavior. It is a sign that cash income is not keeping up with the cost of basic living — and that credit has become the invisible gap-filler between what people earn and what their lifestyle actually costs.
When people start financing food, the credit dependency isn’t a feature of consumer behavior. It’s a symptom of something deeper.
What Happens When the Credit Machine Slows Down
There is no mainstream scenario where consumer credit disappears overnight. But credit does cycle. It contracts. It tightens. It becomes more expensive. And when it does, the sectors most dependent on credit-fueled demand feel it first and hardest.
Here is how the mechanics play out when credit contracts — even modestly:
Demand drops in credit-dependent categories. Retail, auto, furniture, travel, and dining all see top-line revenue decline proportionally to their credit dependency. Businesses that were only viable at credit-inflated volumes face margin compression or closure.
Price pressure follows. When buyers can’t finance at the same terms, sellers have to cut prices to move volume. This looks like deflation in certain categories — but it’s actually credit repricing the market back to cash affordability levels.
Employment follows demand. Revenue declines lead to workforce reductions in consumer-facing industries, which pressures household income, which reduces spending further. The feedback loop is self-reinforcing.
Financial sector stress amplifies the cycle. Card issuers, BNPL platforms, auto finance companies, and the securitization markets tied to consumer receivables all shrink. Fee income drops. Credit availability tightens further. Banks pull back in other areas to compensate.
GDP contracts. Since credit-boosted consumption inflated GDP on the way up, credit contraction deflates it on the way down — and the adjustment can happen faster than the buildup.
None of this is prediction. This is what every prior credit cycle has looked like. The 2008 crisis was a credit contraction in housing. The early 1990s recession was a credit contraction in commercial real estate and consumer lending. The mechanisms are not new.
What is new is the scale of consumer credit dependency — and how thoroughly it has been normalized.
The Question You Should Actually Be Asking
This is not an article designed to make you put your money in a mattress. It’s designed to make you think more clearly about what the numbers actually mean — and what your exposure actually is.
There are two questions that matter:
If 20 to 30 percent of your revenue depends on your customers’ access to credit lines, what is your business worth when that credit cycles down?
And personally:
How much of your own financial plan assumes that asset prices, business volumes, and investment returns will remain at credit-inflated levels permanently?
If you own a business, look at your revenue mix. How much of it depends on consumer discretionary spending? How much of that spending is credit-funded? These aren’t rhetorical questions — they’re the fault lines where a credit contraction would show up on your P&L first.
If you’re building a wealth strategy, understand that a significant portion of the “strong economy” narrative is built on borrowed demand. That doesn’t mean it collapses tomorrow. But it does mean that a wealth strategy built entirely on assumptions of perpetual credit-driven growth is a fragile one.
📖 Related: The Gap Between the Marketing & the Math — The returns many people are projecting are partly a function of credit-inflated asset prices and credit-inflated corporate revenues. A more conservative planning assumption accounts for the possibility that some of that inflation unwinds.
📖 Related: The Misrepresentation of the Average Rate of Return — If projections built on average returns already fell short, credit contraction adds another layer to why those numbers are optimistic.
The Honest Takeaway
The American economy is genuinely productive and genuinely innovative. This is not an argument that everything is fake or about to collapse.
But a meaningful share of what gets reported as economic strength is credit-fueled consumption — borrowed demand that inflates current spending, current prices, current corporate revenues, and current GDP. That borrowed demand will eventually have to be repaid or written off. When that happens, the adjustment will be visible in exactly the sectors most dependent on the credit machine.
Understanding this doesn’t make you a pessimist. It makes you someone who reads the whole report instead of just the headline.
The goal of Wealth & Liberty is to give you the analysis that creates an accurate picture of reality — so you can make financial decisions based on what is true, not what sells advertising or manages someone else’s quarterly earnings call.
Think. The data is public. The numbers are real. The question is whether you’re looking at them.
The Critical Thinking Three
- Look at your own balance sheet. How much of your current lifestyle is funded by income versus credit? What would your monthly cash flow look like if every credit line closed tomorrow?
- If you own a business, what percentage of your customers are financing their purchases? What happens to your revenue if consumer credit tightens by 20%? If you don’t know the answer, that is the risk.
- What assumptions are baked into your wealth strategy? Does it assume that asset prices and corporate revenues will continue at credit-inflated levels? Has anyone stress-tested that plan against a credit contraction scenario?
If this analysis makes you think differently about how your wealth strategy is structured — that’s exactly the kind of conversation the team at Producers Wealth has with business owners and high-income earners every day.
📅 Book a free strategy call with Producers Wealth →
Not ready yet? Join the Wealth & Liberty newsletter — one idea per week that sharpens your thinking on money, markets, and building real financial resilience.
Sources:
- *Bankrate 2025 Credit Card Debt Report — 46–48% of cardholders carry a balance month-to-month; 61% have carried balances for at least a year; 22% doubt they’ll ever pay them off*
- *Bankrate Credit Card Ownership & Usage Statistics — balance prevalence and cardholder behavior*
- *Bankrate Data Center: Time With Credit Card Balance — how long Americans carry revolving balances*
- *Forbes Advisor: Average Credit Card Debt — average per-cardholder balance ~$6,523*
- *Academy Bank: Average American Credit Card Debt 2025 — average balance ~$5,595*
- *New York Fed Household Debt & Credit Report — total U.S. household debt ~$18.8 trillion; credit card balances ~$1.23 trillion*
- *Federal Reserve Consumer Credit Release (G.19) — total revolving and non-revolving consumer credit*
- Experian State of the Automotive Finance Market — auto loan balances ~$1.67 trillion; financing rates at point of purchase
- Federal Reserve Diary of Consumer Payment Choice (2023) — credit card share of consumer expenditures
- BNPL industry research — BNPL adoption rates, average order value lift, category breakdown
© Wealth & Liberty. For educational purposes only. Not financial advice. Always consult a licensed professional for guidance specific to your situation.